Trading Patterns on Exness
Trading CFD involves risks
Exness Trading PatternsArticle created:
05.07.2024What are Trading Patterns?
A price or trading pattern is a shape to understand in price movements, and can be detected with trend lines. When this pattern changes in the trend’s direction, then we can name it: a reversal pattern. If the trend continues in the same way after a pause, then we can name it: continuation pattern. Traders use many different trading patterns and below we will analyse some of them.
Main Types of Trading Patterns
Candlestick Patterns
In this part we will analyze six different candlestick patterns
White Candle (Bullish candle) Pattern
A white (in cryptocurrency mostly green) candlestick indicates that the closing price was higher than the opening price. The body of the candle is filled with no shadows or very small shadows.
For example, If a stock opens at $100 and closes at $112, it forms a white candle.
Hammer Pattern
This pattern has a small body at the upper end with a long lower shadow. It indicates potential bullish reversal after a downtrend.
As an example, If a memecoin (cryptocurrency) is at $1000, drops to $920, but then at $995, it forms a hammer.
Doji Pattern
is when the opening and closing prices are almost the same, resulting in a very small body. It suggests hesitancy in the market.
To give an example, If Bitcoin is now $100000, moves up to $110000, down to $95000, and closes again at $100000, it forms a Doji.
Shooting star Pattern
a pattern has a small main body at the lower end with a long upper trace. It indicates potential bearish reversal after an uptrend.
For instance: If a stock opens at $100, rises to $107, but then closes at $103, it forms a shooting star.
Bullish Engulfing Pattern
A bigger (larger) white candle follows a smaller black candle.This pattern indicates a potential bullish reversal.
i.e: If a stock has a small black candle where it opens at $100 and closes at $95, followed by a larger white candle where it opens at $97 and closes at $106, it forms a bullish engulfing pattern.
Bearish Engulfing Pattern
A larger black candle follows a smaller white candle, completely engulfing it. This pattern indicates a potential bearish reversal.
In this case: If silver has a small white candle where it is at $30 and closes at $35, followed by a larger black candle where it opens at $37 and closes at $28, it forms a bearish engulfing pattern.
Trading CFD involves risks
Try Types of Trading PatternsChart Patterns
In this part we will analyze three different chart patterns
Head and Shoulders: This pattern has three peaks: a higher peak (head) between two lower peaks (looks like shoulders). It indicates a potential reversal from bullish to bearish.
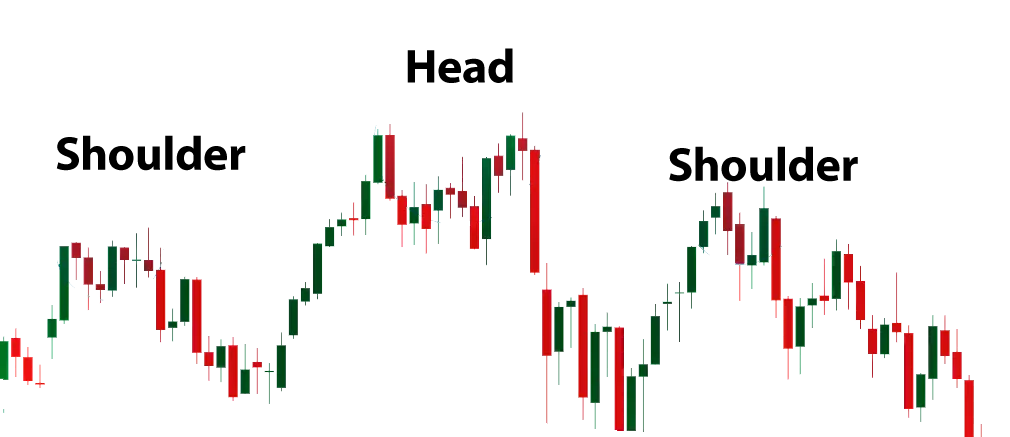
For example: A stock rises to $150 (left shoulder), falls to $145, rises to $155 (head), falls to $145, rises to $150 (right shoulder), and then falls below the support level at $145.
Double Bottom: This pattern looks like a letter W and indicates a potential reversal from bearish to bullish. It forms after a downtrend.
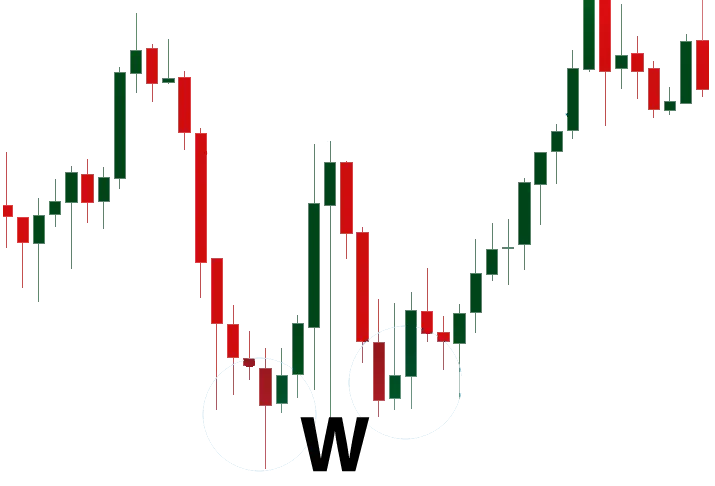
For instance: A stock falls to $140, rises to $145, falls back to $140, and then rises above $145, indicating a bullish reversal.
Double Top: This pattern looks like a letter M and indicates a potential reversal from bullish to bearish. It forms after an uptrend.
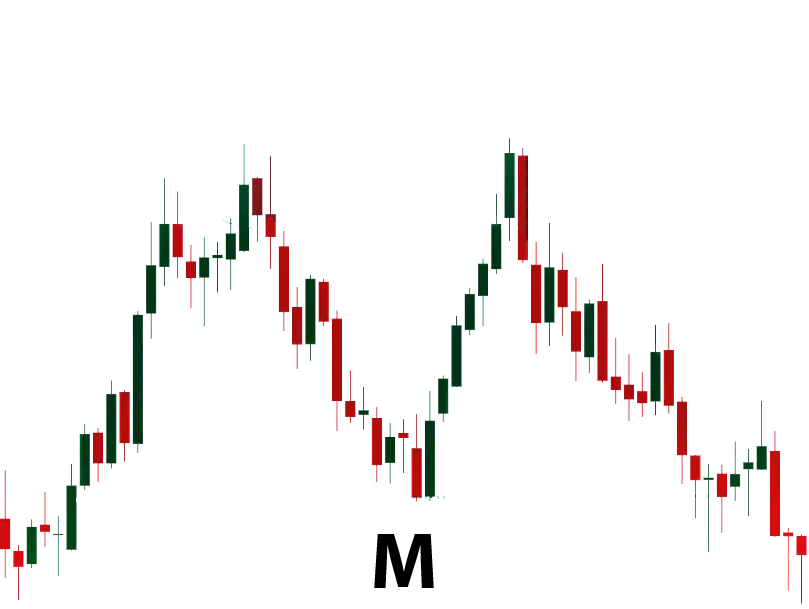
As an example: A stock rises to $160, falls to $155, rises again to $160, and then falls below $155, indicating a bearish reversal.
How to Use Trading Patterns in Trading on Exness
Day Trading
Here are the five main objects for using trading patterns with day trading.
- Identify Trends:
Analyze the trend (uptrend, downtrend, or sideways). Candlestick patterns are more reliable when they align with the overall trend. You can still use the one you feel comfortable with. - Confirm with Volume:
High trading volume can validate the significance of a candlestick pattern. Patterns with low volume might be less reliable. - Use Key Levels:
Support and resistance levels are important. Patterns near these levels can indicate strong buying or selling opportunities. - Combine with Indicators:
Use other technical indicators (e.g., moving averages) to confirm the signals that are given by candlestick patterns. - Risk Management:
Set stop-loss orders to manage potential losses. Candlestick patterns should be used with a solid risk management strategy. In trading it’s most likely to lose money. With Risk management we control the money we can lose ( we can afford the lose).
Trading CFD involves risks
Start Use Trading Patterns exnessSwing Trading
Swing trading is a trading style at making short- to medium-term profits in stocks or other financial instruments over a 2-3 days to several weeks. Swing traders in general use technical analysis to find trading opportunities but may also use fundamental analysis to study the market.
Fundamental analysis is to search for new information from sources like news updates on the global economy or an economic calendar. This is a cautious method that focuses on a select few forex pairs, becoming highly proficient with specific pairs like EUR/USD or USD/JPY, for instance.
Technical Analysis
Technical analysis relies on the idea that all necessary information is already present in the charts. By recognizing patterns and situations previously observed in the charts, you can analyze multiple forex pairs quickly and efficiently. This method allows for easy switching between different pairs, unlike the more time-consuming fundamental analysis approach.
How to Learn Trading Patterns
Practice and Use of Demo Accounts
You can practice trading patterns using Exness demo accounts with the help of Mobile or PC versions. The more practice you have the better you become in trading.
Conclusion Exness Trading Patterns
Trading patterns help predict price reversals using specific Fibonacci levels. Understanding these patterns can improve trading decisions. However, relying on trading patterns is not recommended. It is better to have a mixture of analysis as well as with fundamental analysis + sentimental analysis.
Trading CFD involves risks
Practice patterns on ExnessFrequently Asked Questions about Trading Patterns
What is the most effective pattern in trading?
The head and shoulders chart pattern and the triangle chart pattern are two of the most frequently seen patterns in forex trading. These patterns appear more often than others and offer a straightforward foundation for further analysis and decision-making.
What time frame is best for chart patterns?
Begin with a primary time frame, typically daily or weekly, to identify the main pattern. Then, use shorter intervals, like hourly or 15-minute charts, to pinpoint precise entry and exit points. Additionally, use a longer time frame, such as a monthly chart, to evaluate the overall trend.
How to predict chart patterns?
Measure the height from the highest peak to the lowest point in the pattern. Subtract this height from the lowest point in the pattern. The result gives you the target price. This method helps you estimate where the price might go after the pattern completes.