Trading Indices on Exness
Trading CFD involves risks
Exness Trading IndicesArticle created:
26.06.2024What is Index Trading?
Definition of Index Trading
An index measures how a group of assets, like publicly traded companies, are performing. In trading, this often involves tracking the stock prices of major companies. Trading indices are available in Exness.
As an example, one of the most famous indices is the Dow Jones Industrial Average (DJIA). It tracks the performance of 30 large US companies. If the stock prices of these companies go up, the DJIA goes up too. If they go down, the DJIA also falls.
Examples of Index Trading
Here are some of the most popular indices in the world, many of which include “blue-chip” stocks. Blue-chip companies are well-established, leaders in their sectors, and usually have very high market values.
- Dow Jones Industrial Average (DJIA):
Tracks 30 large, US-listed companies. - FTSE 100:
Represents the 100 biggest companies on the London Stock Exchange. - S&P 500:
Includes 500 of the largest companies listed on US stock exchanges. - Nasdaq 100:
Mostly includes major technology companies, featuring 101 securities from the 100 largest non-financial companies on NASDAQ. - EURO STOXX 50:
Tracks 50 top companies in the eurozone, similar to the Dow Jones for Europe. - DAX 40:
Germany’s key stock index, consisting of 40 major companies on the Frankfurt Stock Exchange. - CAC 40:
Includes 40 leading companies on Euronext Paris. - Hang Seng:
Tracks 73 large companies on the Hong Kong Stock Exchange. - Nikkei 225:
Japan’s main stock index, covering 225 large companies on the Tokyo Stock Exchange. - ASX 200:
Benchmark index for Australia, including the 200 largest stocks on the Australian Securities Exchange.
Trading CFD involves risks
Trading popular indicesWhy Choose Exness for Index Trading?
Benefits of Trading Indices on Exness
Indices have been popular among both beginner traders and experienced investors for many reasons:
- Less Capital Needed:
Starting with index trading requires less money than trading actual futures contracts, and the costs are lower. - Diversification:
Index trading spreads your investment across many stocks, reducing the impact of any single stock’s performance on your portfolio. - Leverage:
Some index trading products, like futures and CFDs, offer leverage, letting you control larger positions with less capital, which can increase both potential profits and losses. - Liquidity:
Major indices are highly liquid, meaning there are many buyers and sellers, allowing for efficient trade execution with minimal price changes. - Hedging:
You can use index trading to protect against potential losses in other parts of your portfolio. For example, if you have many stocks, you can use index futures to guard against overall market declines.
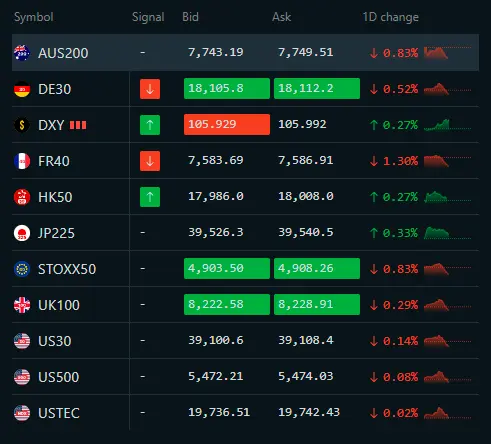
Available Indices on the Exness Platform
List of indices available for trading on Exness are below:
AUS200
Australia S&P ASX 200 Index
DE30
Germany 30 Index
FR40
France 40 Index
HK50
Hong Kong 50 Index
JP225
Japan 225 Index
STOXX50
EU Stocks 50 Index
UK100
UK 100 Index
US30
US Wall Street 30 Index
US500
US SPX 500 Index
Trading CFD involves risks
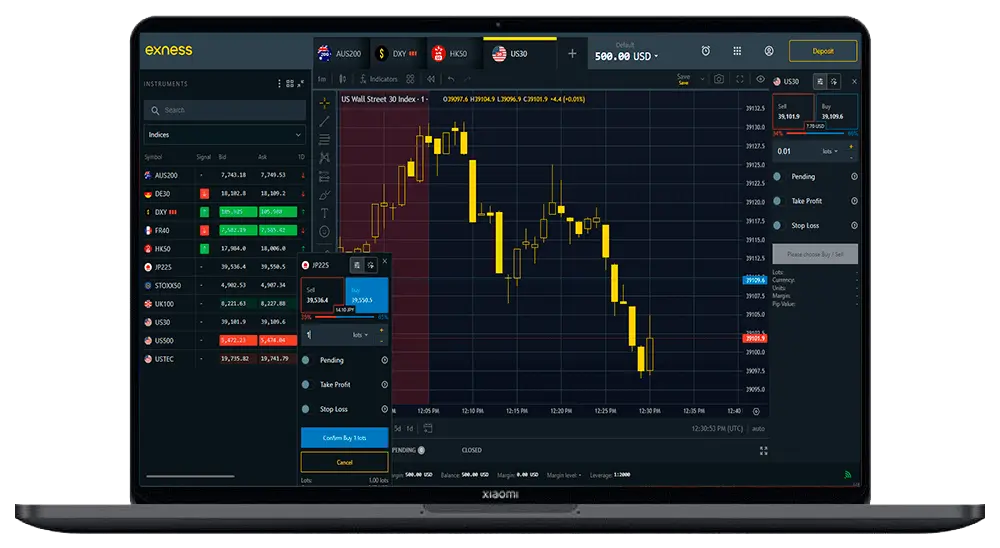
Trade available indicesExness Apps for Index Trading
With Exness broker, you can trade indices using:
Key Index Trading Strategies
Examples of Index Trading Strategies
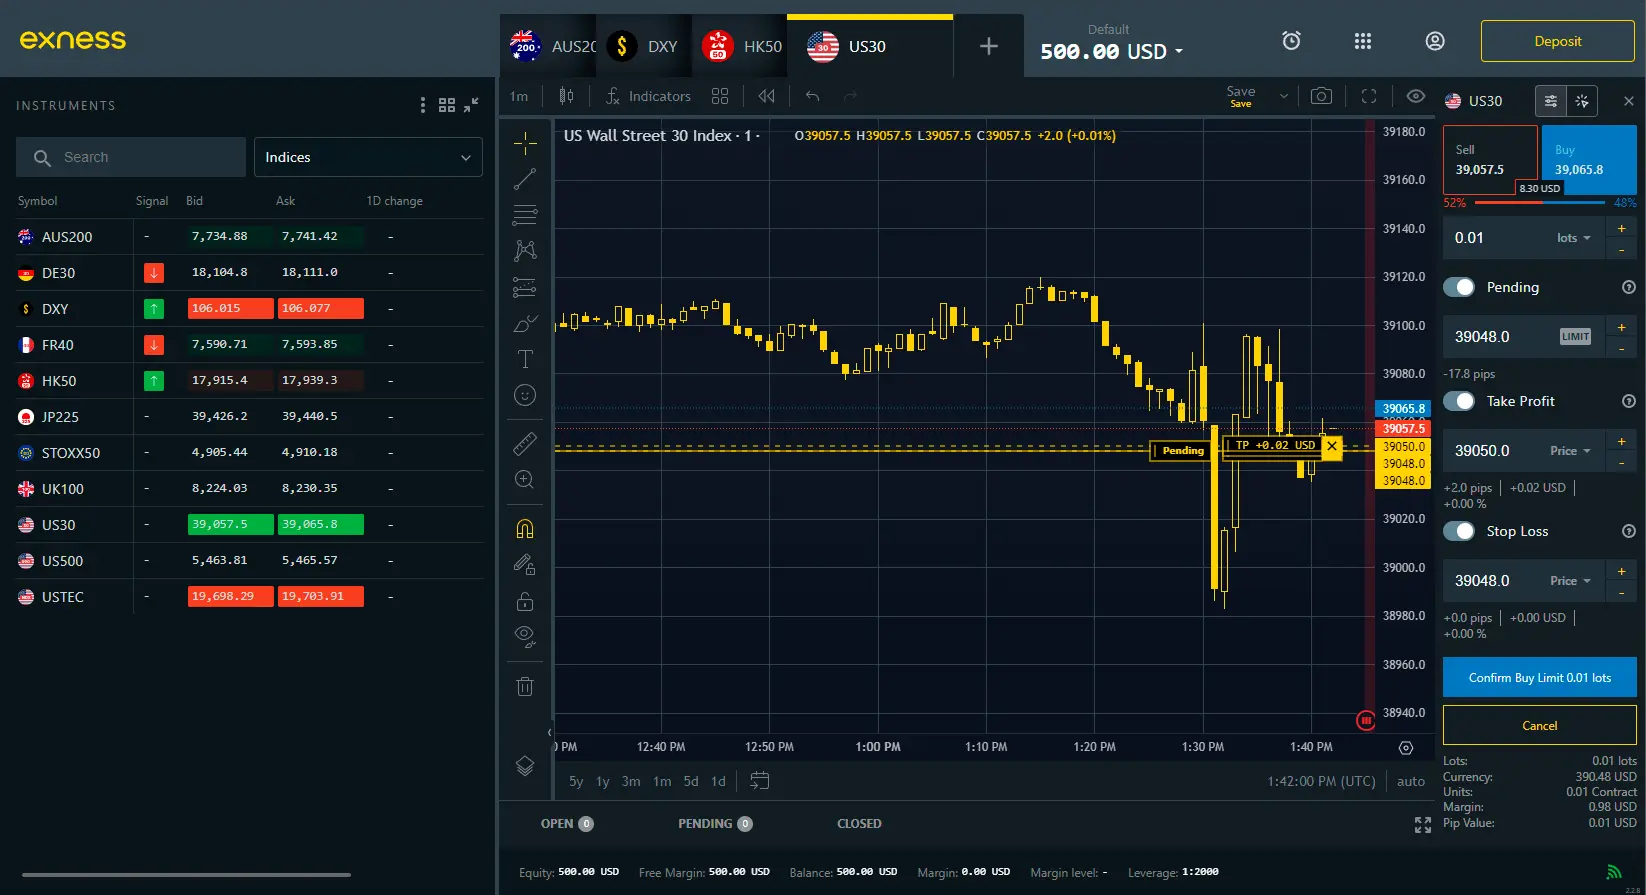
Trading indices is easy using Exness services. You can trade indices five days a week and start with a small amount of money. Here’s a simple step-by-step guide on how to trade indices:
- Open your Exness account:
Use your credentials to login and access your personal area. - Fund your account:
After your account is verified, deposit funds to start trading. - Pick an index to trade:
With your account funded, select the index you want to trade, such as the AUS200m: Australia S&P ASX 200 Index DE30m: Germany 30 Index FR40m: France 40 Index. - Plan your trading strategy:
Decide how much to invest, set stop-loss and take-profit orders, and determine your risk tolerance. Consider how much you’re willing to lose if the trade goes against you. - Place your trade:
Enter the amount you want to invest, choose to buy or sell, and set your stop-loss and take-profit orders. - Monitor your trade:
Keep an eye on your trade to ensure it’s performing as expected. You can close your trade at any time to take profits or cut losses.
If you’re new to trading indices, educate yourself on how the market works and the possible risks. Start with a small amount of money that you’re willing to lose during the learning phase.
Trading CFD involves risks
Try Index Trading StrategiesTechniques and Methods for Index Trading
Let’s say the FTSE is currently trading at 6800.50.
Your analysis suggests a good opportunity to buy, and you believe the market sentiment is positive for the FTSE. You decide to buy one lot, where each point movement in the index equals a USD$1 profit or loss.
Two days later, the FTSE rose to 6850.50, just as you expected. To calculate your profit, you subtract the opening price from the closing price:
(6850.50 – 6800.50) x USD$1 = USD$50.
Index Trading Hours
Different indices are traded at different times, depending on their exchange. If you’re new to trading, it might be wise to avoid these high-volatility hours, as prices can change rapidly. However, this period is also a great opportunity to watch and learn how the market behaves.
The best time to trade is when the markets open in different time zones. Since index markets don’t operate 24/7 like the currency market, you need to pick the right time to make your trades.
Trading CFD involves risks
Exness IndicesIndex Market Trading Hours
There are certain times during the trading week when market activity picks up, as traders react to recent news and events. One of the best times for experienced traders is between 9:30 and 10:30 a.m. ET, because that’s when you see the biggest price changes in the shortest time. Another example: The trading time in India runs from 9.15 am to 3.30 pm. Traders using Exness indices can buy and sell shares freely during this time.
Here are the trading hours for 4 indices in Exness, all in GMT+0 server time:
- AUS200:
Trading: Sunday 22:05 to Friday 20:00
Daily Breaks: 06:30-07:10 and 20:59-22:05 - US30, FR40, DE30, USTEC, US500, STOXX50, UK100:
Trading: Sunday 22:05 to Friday 20:00
Daily Break: 21:00-22:05 - JP225:
Trading: Sunday 22:05 to Friday 20:00
Daily Break: 20:59-22:05 - HK50:
Trading: Sunday 22:05 to Friday 20:00
Daily Breaks: 00:45-01:15, 04:30-05:00, 08:30-09:15, and 21:00-22:05
Trading CFD involves risks
Start Trading IndexFrequently Asked Questions about Index Trading on Exness
How does an index work?
An index is a financial indicator that measures the performance of a basket of stocks traded on a particular exchange. For example, the S&P 500 Index lists the top 500 companies with the highest market capitalization on the NYSE. Generally, each stock in the index is given a weighted average relative to their market capitalization, which determines their level of impact on the index price. The stock index price is calculated using live prices of listed stocks and fluctuations also affect the index price according to the weight of the stock.
Why are stock market indices important?
A stock market index represents a specific segment of a stock market, usually the most valuable companies or a specific sector such as finance. Indices allow investors to measure the health and performance of business operations. They also help spot long-term trends to predict investment returns and identify new opportunities. Stock indices are generally more stable and predictable, which is why many day traders choose to buy and sell index Contracts for Difference (CFDs) while avoiding the many times the risk of investing in individual stocks.
What is the best way to analyze the stock market index?
Each stock market index is slightly different compared to others, and index details such as components, weight, calculation and trading hours need to be studied. Factors such as earnings reports or sectors represented, which can fundamentally affect stock prices, have a strong impact on the index. Economic data such as GDP (Gross Domestic Product) can also affect the price by stimulating the valuation currency. Technically, trends are relatively stable, making support and resistance levels reliable indicators of price targets and reversal points.
What’s the difference between index trading and stock trading?
Stock trading involves buying and selling shares of specific companies at their individual prices. When you buy a stock, it transfers to you from the seller, and you become the owner. Index trading, on the other hand, involves trading a group of stocks that make up an index using a single instrument. An index represents a group of stocks that give a general view of the market as a whole (like the Dow Jones Industrial Average) or a specific sector (like the FTSE 100 for UK companies).